


John Maunder
sunlive.co.nz
Rainfalls for the month of July have been recorded in Tauranga since 1898, except for 1904, 1907, 1908, and 1909.
The graph for the period 1898-2021 shows the range of rainfalls from an extreme high of 348 mm in 1951, to a low of only 2 mm in 1902.
The rainfall for July 2021 was 122 mm. The graph shows the second wettest July was 2012 when 328 mm was recorded, and the second driest July was in 1983 when only 22 mm fell.
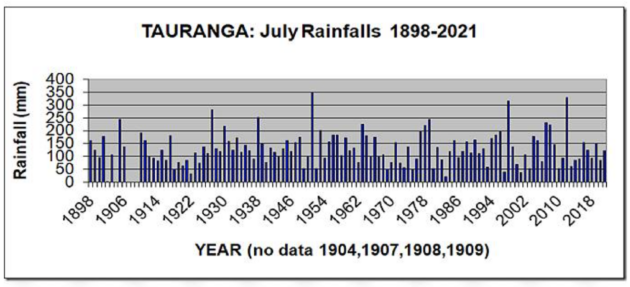
The long-term average rainfall for Tauranga for July is 129 mm. The graph of the July rainfall shows ‘normal’ variations from year to year.
There is a very small decrease in the overall July rainfalls during the last 50 years (1961-2010) from an average of 127 mm, compared with an average of 132 mm during the 50 years from 1911-1960.
Since 1898, there have been 13 July months with a rainfall of 200 mm or more, but only four July months with rainfalls of 40 mm or less.
The ten wettest July months (in chronological order) have been 1905, 1927, 1938, 1951,1963,1979,1988, 2007, 2008, and 2012. The ten driest July months ( in chronological order) have been 1902, 1918, 1922, 1949, 1969, 1975, 1983, 1997, 2001, and 2010,
For further Infomation about a wide range of weather/climate matters see my new book Fifteen shades of climate… the fall of the weather dice and the butterfly effect.
BUY Your Own Copy of Dr John Maunders book Fifteen Shades of Climate Today.

Please share so others can discover The BFD.