


John Maunder
The Southern Oscillation Index (SOI) is a standardized index based on the observed sea level pressure differences between Tahiti and Darwin, Australia.
The SOI is a leading measure of the large-scale fluctuations in air pressure occurring between the western and eastern tropical Pacific (i.e., the state of the Southern Oscillation) during El Niño and La Niña episodes.
In general, smoothed time series of the SOI correspond very well with changes in ocean temperatures across the eastern tropical Pacific. The negative phase of the SOI represents below-normal air pressure at Tahiti and above-normal air pressure at Darwin. The positive phase of the SOI represents above-normal air pressure at Tahiti and below-normal air pressure at Darwin.
Prolonged periods of negative SOI values coincide with abnormally warm ocean waters across the eastern tropical Pacific typical of El Niño episodes. In contrast, prolonged periods of positive SOI values coincide with abnormally cold ocean waters across the eastern tropical Pacific typical of La Niña episodes. Sustained negative values of the SOI below ?8 often indicate El Niño episodes.These negative values are usually accompanied by sustained warming of the central and eastern tropical Pacific Ocean, a decrease in the strength of the Pacific Trade Winds.
Sustained positive values of the SOI above +8 are typical of a La Niña episode.They are associated with stronger Pacific trade winds and warmer sea temperatures to the north of Australia. Waters in the central and eastern tropical Pacific Ocean become cooler during this time.
The Australian Bureau of Meteorology reports as of May 11, 2011 that the El Niño–Southern Oscillation (ENSO) continues at neutral levels. Climate model outlooks currently indicate this neutral phase will last at least until October.
Oceanic indicators of ENSO persist at neutral levels, with Pacific sea surface temperatures close to the long-term average across most of the equatorial region. Beneath the surface, temperatures are near-average, with slightly warmer than average waters across much of the sub-surface. Atmospheric indicators such as the Southern Oscillation Index (SOI) and cloud patterns are also close to average. Trade winds have been stronger than average in the far west, but near average elsewhere.
The Madden–Julian Oscillation (MJO) is over the Indian Ocean region. It is forecast to move eastwards across Australian longitudes over the coming fortnight.
The Southern Annular Mode (SAM) has been positive for the past week. It is expected to remain positive for the coming fortnight.
The Indian Ocean Dipole (IOD) is currently neutral. Climate model outlooks suggest the IOD is most likely to remain neutral during the first half of winter.
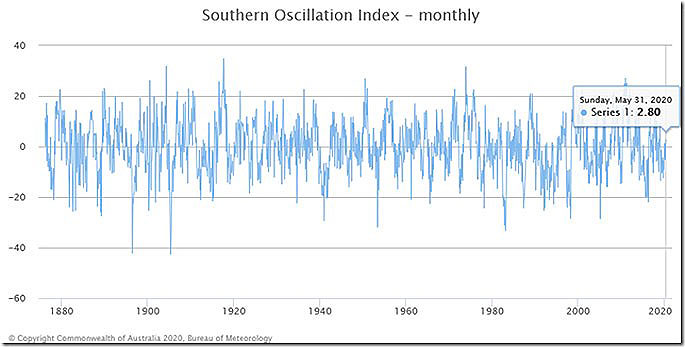
The graph below ( from the Australian Bureau of Meteorology, BOM) shows monthly values of the SOI from 1880 to April 2020.
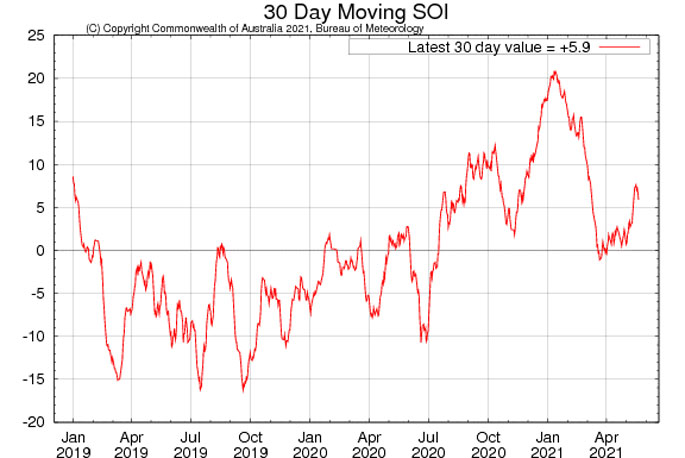
The graph below ( from the Australian Bureau of Meteorology, BOM) shows monthly values of the SOI from January 2018 to mid-May 2021.
During El Niño, New Zealand tends to experience stronger or more frequent winds from the west in summer, typically leading to drought in east coast areas and more rain in the west. In winter, the winds tend to be more from the south, bringing colder conditions to both the land and the surrounding ocean.In spring and autumn south–westerly winds are more common.
La Niña events have different impacts on New Zealand’s climate. More north–easterly winds are characteristic, which tend to bring moist, rainy conditions to the north–east of the North Island, and reduced rainfall to the south and south–west of the South Island. Therefore, some areas, such as central Otago and South Canterbury, can experience drought in both El Niño and La Niña. Warmer than normal temperatures typically occur over much of the country during La Niña, although there are regional and seasonal exceptions.
Although ENSO events have an important influence on New Zealand’s climate, it accounts for less than 25 per cent of the year to year variance in seasonal rainfall and temperature at most New Zealand measurement sites.
For further information about a wide range of weather/climate matters read my new book Fifteen shades of climate… the fall of the weather dice and the butterfly effect.
BUY Your Own Copy of Dr John Maunders book Fifteen Shades of Climate Today.
Please share so others can discover The BFD.