

That is effectively what coastal residents around New Zealand are being told by their Local Authorities as councils get their big red pens out and draw lines on ‘hazard’ maps and attach notes to LIMs.
Way back in 2008, the Ministry for the Environment used 2007 data to make up some numbers:

And then local councils were tasked with plotting this nonsense on their hazard maps. Speaking from experience, once there is a line like this on your property LIM it is very difficult to get insurance. If a purchaser needs a mortgage they cannot get one as banks etc require a property to be insured before granting a mortgage. No insurance = no mortgage = no sale. You are sitting on an unsaleable, uninsurable asset.
Instead of a model created 12 years ago, why not use some up-to-date real-world data?
A 2019 study of the most reliable tide gauges in the world, with more than 100 years of good quality data found 76 that matched that benchmark. One was in New Zealand. It was the Dunedin gauge, a city where 3604 homes, 185 businesses and 72km of roads are going to drown according to the alarmists.
What did the long term tide gauge records say? Some were up, some were down. The world average was 0.337mm/yr and the acceleration was 0.007mm/yr2.
Dunedin was above average at 1.325mm/yr with an acceleration of 0.01775mm/yr2.
If you remember the equations of motion from school; the distance over time equation is: s = ut + 1/2at2. Distance = s, current velocity is u, acceleration is a and time is t.
The typical figures being used by Local Authorities, based on central government advice is 400 – 600mm sea level rise by 2080 and 800 – 1600mm sea level rise by 2130.
Using the formula above, with the actual historical data and projecting out to 2080 and 2130 the sea level rise will be:
World average: 33.58 and 80.53mm (compare 400/600 and 800/1600)
Dunedin: 113.85 and 254.42mm (compare 400/600 and 800/1600)

At the current rate, it will 343 years before there is 150cm of sea-level rise in Dunedin, not really a climate emergency that needs a line on property LIMs just yet.
Tasman is the latest area to hit the headlines with this stupidity.
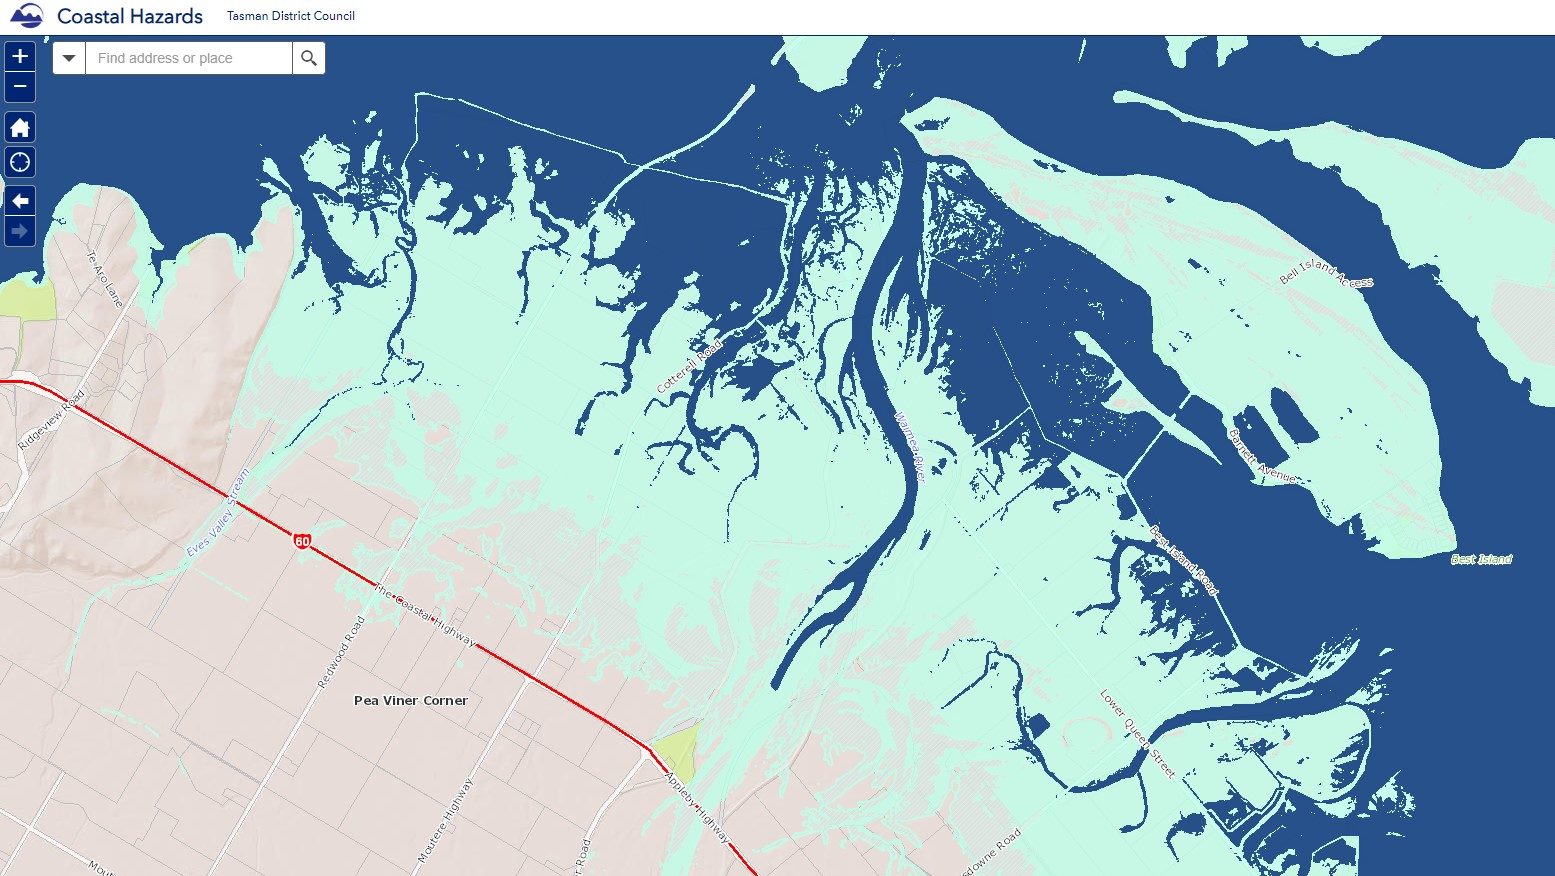
About 5500 letters from Tasman District Council are expected to arrive this week in the mailboxes of people whose properties have been identified as potentially at risk. Those properties are within or partially within areas affected by a range of sea level rise scenarios on new council coastal hazard maps, scheduled to be available on the council website from Monday.
The maps show areas of low-lying land and how it may be affected by sea level rise scenarios in half-metre increments, from 0.5 metres to 2m. They also show the effect of a higher tides caused by storms. Areas of coastal erosion and sediment gain have been mapped along with structures such as stopbanks, walls and rock revetments.
Stuff