


John Maunder
sunlive.co.nz
The Southern Oscillation Index (SOI) is a standardized index based on the observed sea level pressure differences between Tahiti and Darwin, Australia.
The SOI is a leading measure of the large-scale fluctuations in air pressure occurring between the western and eastern tropical Pacific (i.e., the state of the Southern Oscillation) during El Niño and La Niña episodes.
In general, smoothed time series of the SOI correspond very well with changes in ocean temperatures across the eastern tropical Pacific. The negative phase of the SOI ( El Nino) represents below-normal air pressure at Tahiti and above-normal air pressure at Darwin. The positive phase of the SOI (La Nina) represents above-normal air pressure at Tahiti and below-normal air pressure at Darwin.
Prolonged periods of negative SOI values coincide with abnormally warm ocean waters across the eastern tropical Pacific typical of El Niño episodes. In contrast, prolonged periods of positive SOI values coincide with abnormally cold ocean waters across the eastern tropical Pacific typical of La Niña episodes. Sustained negative values of the SOI below -8 often indicate El Niño episodes. These negative values are usually accompanied by sustained warming of the central and eastern tropical Pacific Ocean, a decrease in the strength of the Pacific Trade Winds.
La NIña Nears Its End
The 2020–21 La Niña is nearing its end, with most oceanic indicators of the El Niño-Southern Oscillation (ENSO) now at neutral levels. However, a number of atmospheric indicators remain at La Niña levels, meaning La Niña’s influence is likely to persist into April.Tropical Pacific Ocean sea surface temperatures have returned to ENSO-neutral values in the past fortnight. Below the surface, waters have also been warming. However, atmospheric indicators such as cloudiness near the Date Line and trade winds persist at La Niña levels. The Southern Oscillation Index (SOI) in recent days has dipped below La Niña thresholds, although this may just be a temporary easing.
These changes in indicators are consistent with climate model outlooks, which for several weeks have indicated a return to ENSO neutral during the southern hemisphere autumn. While around 40% of past La Niña events have re-strengthened for a second year, there are currently no models suggesting that La Niña will return during winter.
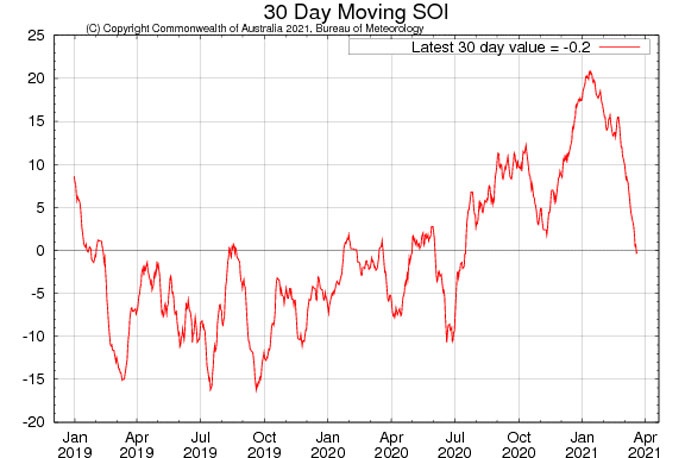
The graph above ( from the Australian Bureau of Meteorology, BOM) shows monthly values of the SOI from January 2018 to 20 March 2021.
The 30-day Southern Oscillation Index (SOI) for the 30 days ending mid March 2021 was +0.3.
El Nino and La Nina weather affects over New Zealand (Source Niwa)
During El Niño, New Zealand tends to experience stronger or more frequent winds from the west in summer, typically leading to drought in east coast areas and more rain in the west. In winter, the winds tend to be more from the south, bringing colder conditions to both the land and the surrounding ocean.In spring and autumn south–westerly winds are more common.
La Niña events have different impacts on New Zealand’s climate. More north–easterly winds are characteristic, which tend to bring moist, rainy conditions to the north–east of the North Island, and reduced rainfall to the south and south–west of the South Island. Therefore, some areas, such as central Otago and South Canterbury, can experience drought in both El Niño and La Niña. Warmer than normal temperatures typically occur over much of the country during La Niña, although there are regional and seasonal exceptions.
Although ENSO events have an important influence on New Zealand’s climate, it accounts for less than 25 per cent of the year to year variance in seasonal rainfall and temperature at most New Zealand measurement sites.
BUY Your Own Copy of Dr John Maunders book Fifteen Shades of Climate Today.

Please share so others can discover The BFD.