

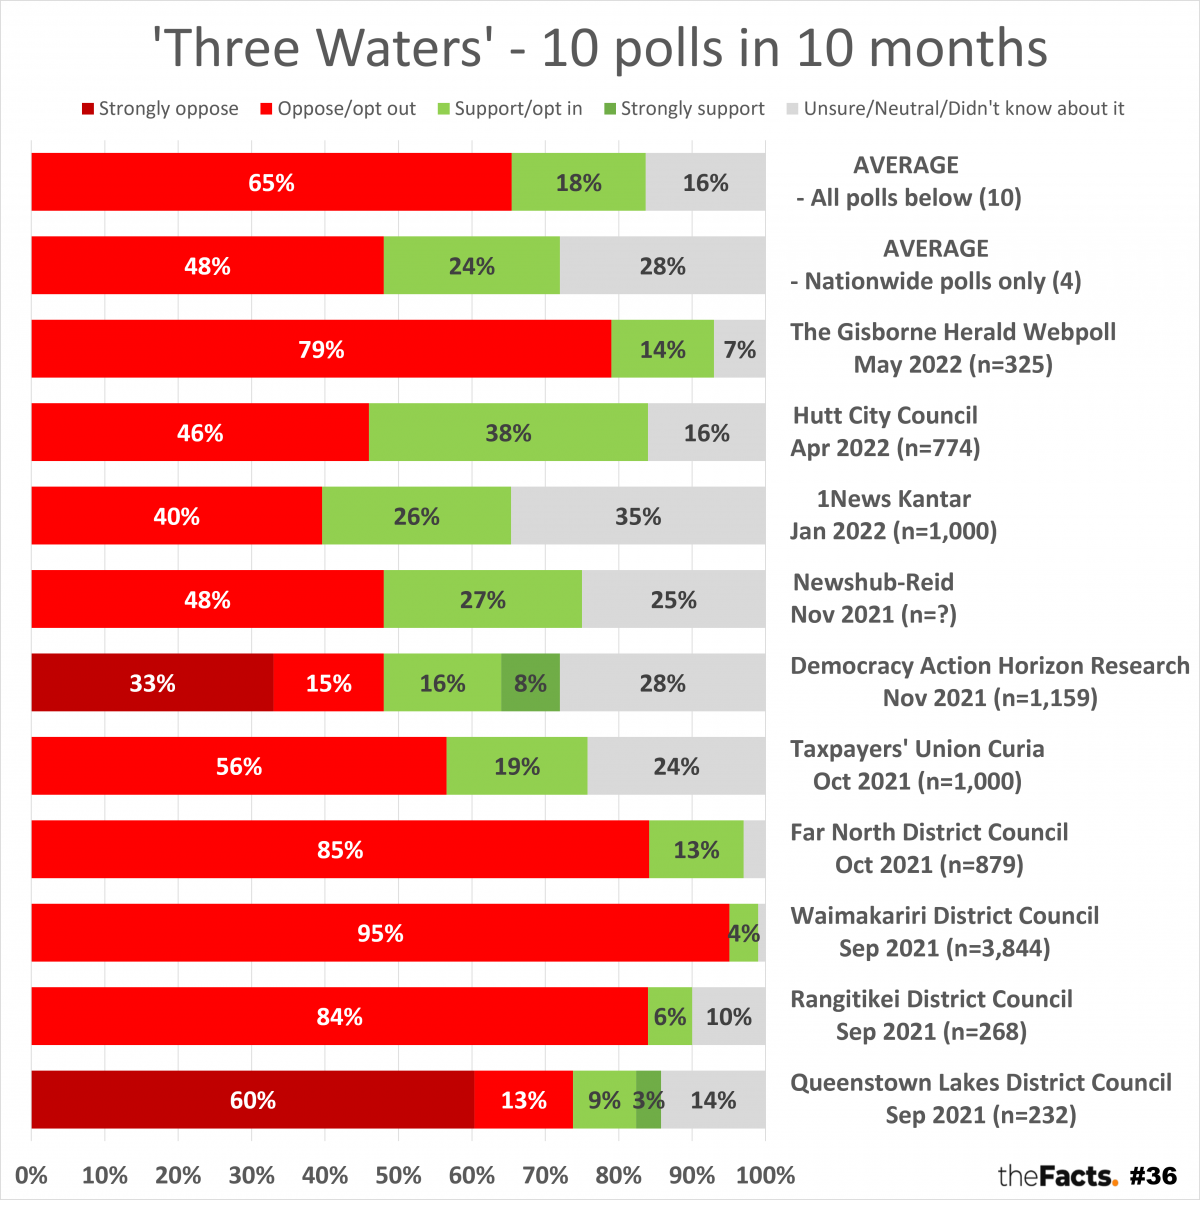
The Facts has a summary of 10 polls on Three Waters. It seems that the Government simply isn’t listening to the people. All polls point to a significant majority dismissing the Government’s insistence on ramming through their anti-democratic Three Waters.
Key insights
- Four nationwide polls = 2:1 Kiwis oppose Three Waters
- All 10 polls = 3.6:1 Kiwis oppose Three Waters
Is the Government listening to its people?
Do you know of other Three Waters polls that we can add to this summary? If so, please contact us.
Make sure you also explore the source links below, as the polling results provide many other insights beyond what a single graph can present, e.g. the Horizon Research asked how Three Waters will impact political party voting.
Notes
- Each poll asked the question in a slightly different way with, sometimes, slightly different answer options. We have done our best to create a consistent and fair summary. All questions and sources are provided in the sources section below so that you can see these for yourself.
- Originally, the Three Waters proposal was optional, and councils were allowed to opt-in or opt-out which is why some of the earlier council polling asked this question of their ratepayers/constituents. More recently, the Government has removed this opt-in option and has proposed making Three Waters mandatory for all councils.
- Submissions on the Three Waters Services Entity bill closed on Friday 22nd July 2022. You can follow the Bill’s progress via this link https://www.parliament.nz/en/pb/sc/make-a-submission/document/53SCFE_SCF_BILL_124081/water-services-entities-bill.
- Polls were discovered by looking at all 9 pages of Google search results for “three waters poll nz” under the All results tab. We also checked the News tab but didn’t find any more. And we also checked https://en.wikipedia.org/wiki/Three_Waters_reform_programme but only two polls were cited on there. If you know of other credible polls we missed, please contact us so that we can add them.
- We have displayed the averages at the top of the graph, followed by the individual poll results in chronological order from most to least recent. Where polls were conducted in the same month, we have displayed them in alphabetical order from the bottom-up.
- We felt it was important to break out an average for the four nationwide polls as they are more likely to be reflective of all New Zealanders. Councils can vary greatly in their ratepayer mix, e.g. urban, suburban, rural, industrial, and also their geographic proximity to Wellington’s decision makers, so can have very strong feelings one way or the other, e.g. Hutt City Council with 38% support vs Waimakariri District Council with just 4% support.
- We left the smaller Gisborne Herald Webpoll in as it was the most recent polling publicly available and we felt it was important to represent all voices and towns/cities. There is bias with all polls of course, and often more so with online newspaper polls.
- We also left in the smaller Rangitikei District Council (n=268) and Queenstown Lakes District Council (n=232) polls so that all voices and towns/cities could be heard. n=1000 is generally considered best practice for local or central government polls.
- Apologies for the text alignment in the vertical axis. Excel is amazing, but not perfect. If you can help us take the graphic design up a notch, please let us know.
- All numbers are provisional and subject to revision.
Ommissions
In chronological order from oldest to newest.
- Tauranga Ratepayers Alliance, Sep 2021 (n=?)
https://www.taurangacommunityfeedback.com/interim-three-waters-survey-results
The results page doesn’t show the research methodology or the sample size. They also didn’t ask a general support or oppose question like the others in the graph above. There was also a lot of biased language on that results page, so we can’t be sure there wasn’t a strong bias in the polling design. - Auckland Council Kantar Public, Dec 2021 (n=2000)
https://ourauckland.aucklandcouncil.govt.nz/news/2022/02/strong-support-for-auckland-council-s-views-on-government-three-waters-reform-proposal/
This appears to have asked the question in a slightly different way and we could not find a public release of the full data with the research methodology, sample size, questions, or answer options. We have asked them for this information so that we can add it to this graph if possible. - Taxpayers’ Union Curia, May 2022 (n=1,000)
https://www.taxpayers.org.nz/three_waters_poll2
This asked a related but different question “Do you think those who are responsible for provision of local drinking, waste, and storm water services should be directly accountable to voters?”. 76% said yes, 8% said no, and 15% were unsure. - Napier City Council, July 2022.
https://www.sayitnapier.nz/ncc/three-waters-survey/
The results have not been released yet.
Sources
In chronological order from oldest to newest, and chronological.
- Queenstown Lakes District Council, Sep 2021 (n=232)
https://letstalk.qldc.govt.nz/three-waters-survey
“How would you describe your opinion on the three waters reform?”- Very negative = 60.3%
- Negative = 13.4%
- Neutral = 9.5%
- Positive = 8.6%
- Don’t know = 4.7%
- Rangitikei District Council, Sep 2021 (n=268)
https://www.rangitikei.govt.nz/files/general/Other/Three-Waters-Survey-Results-28-Sep-2021.pdf.
There were two similar questions so we averaged the two. Exact numbers weren’t provided, so we have done this by eye off the graph for now, and asked the council for the full data.
“STATEMENT EIGHT: Three waters should be managed and operated locally by people who understand our area”.
“STATEMENT NINE: The three waters infrastructure assets should remain in local ownership (Assets mean things like pipes, water pump stations, water treatment plants)”- Agree = ~84%
- Disagree = 6%
- Don’t know = 10%
- Waimakariri District Council, Sep 2021 (n=3,844)
https://letstalk.waimakariri.govt.nz/threewatersreform/news_feed/community-feedback
“New Zealand’s Government recently announced a proposal to change the way three waters services (drinking water, stormwater and wastewater) are provided across the country. Waimakariri District Council would like to hear residents’ views, including whether we should opt-in or opt-out, based on the information we have available to date.”- Opt out = 95.1%
- Opt in = 3.9%
- Undecided = 1.0%
- Far North District Council, Oct 2021 (n=879)
https://www.fndc.govt.nz/files/assets/public/objectivedocuments/corporate-management-cor/communications-and-public-relations/external-communications/far-north-dc-three-waters-survey-2021-public.pdf
We are unsure of the exact question they asked, but have asked them. The link above suggests that they provided a lot of background information first. This could have introduced polling bias.- Opt out = 85%
- Opt in = 13%
- Unsure = 3%
- Taxpayers’ Union Curia, Oct 2021 (n=1,000) https://d3n8a8pro7vhmx.cloudfront.net/taxpayers/pages/1825/attachments/original/1634783364/Three_Waters_Poll_Results_Oct_2021.pdf?1634783364
“The Government has proposed removing management and ownership of what is called the three waters, drinking water, wastewater and storm water from elected local councils to four regional water entities whose boards will be half appointed by councils and half appointed by Iwi. Do you support or oppose the proposed three waters reforms?”- Support = 19%
- Oppose = 56%
- Unsure = 24%
- Democracy Action Horizon Research, Nov 2021 (n=1,159) https://d3n8a8pro7vhmx.cloudfront.net/democracyaction/pages/1954/attachments/original/1639609724/Horizon_Research_Three_Waters_Survey_November_2021.pdf?1639609724
“Now you have been made aware of the background to the Government’s Three Waters proposal, do you support the transfer of water delivery assets and services from local authorities to four multi-regional entities?”- Strongly oppose = 33%
- Oppose = 15%
- Support = 16%
- Strongly support = 8%
- Neither support nor oppose = 14%
- Not really sure = 14%
- Newshub-Reid, Nov 2021 (n=?)
https://www.newshub.co.nz/home/politics/2021/11/newshub-reid-research-poll-half-of-new-zealand-doesn-t-support-three-waters-reforms.html
Do you support Three Waters?- Yes = 27.3%
- No 47.7%
- Don’t know 25%
- 1News Kantar, Jan 2022 (n=1,000)
https://www.1news.co.nz/2022/01/27/full-results-1news-kantar-public-poll-january-22-26-2022/
“The Government made a decision in October 2021 to progress its Three Waters Reform. The reform impacts the way in which our drinking water, wastewater and storm water services are managed in New Zealand. From what you have heard so far, do you currently support or oppose the reforms?”- Oppose = 40%
- Support = 26%
- Don’t know enough to make a decision = 22%
- Haven’t heard of the Three Waters Reform = 13%
- Hutt City Council, Apr 2022 (n=774)
https://hccpublicdocs.azurewebsites.net/api/download/558768dc758a4ed99c70d1dfc9b2c388/_CM9-WE/a7c6f2cd674304148728d346f27c961cbc8
Exact question not yet known. We have asked. The link above states “When asked whether you supported the
Government’s proposed reforms”- Opposed = 46%
- Support = 38%
- Neutral = 16%
- The Gisborne Herald Webpoll, May 2022 (n=325)
https://www.gisborneherald.co.nz/local-news/20220507/most-webpoll-voters-against-modified-plan-to-reform-three-waters/
“Do you support the Government’s modified plan for Three Waters Reform”- No = 79%
- Yes = 14%
- Don’t Know = 7%
Please share this article so others can discover The BFD.