

We can reveal the results of the third monthly Taxpayers’ Union Curia Poll that shows a 6 point drop in support for Labour, while National and the Greens are up.
Here are the headline results:

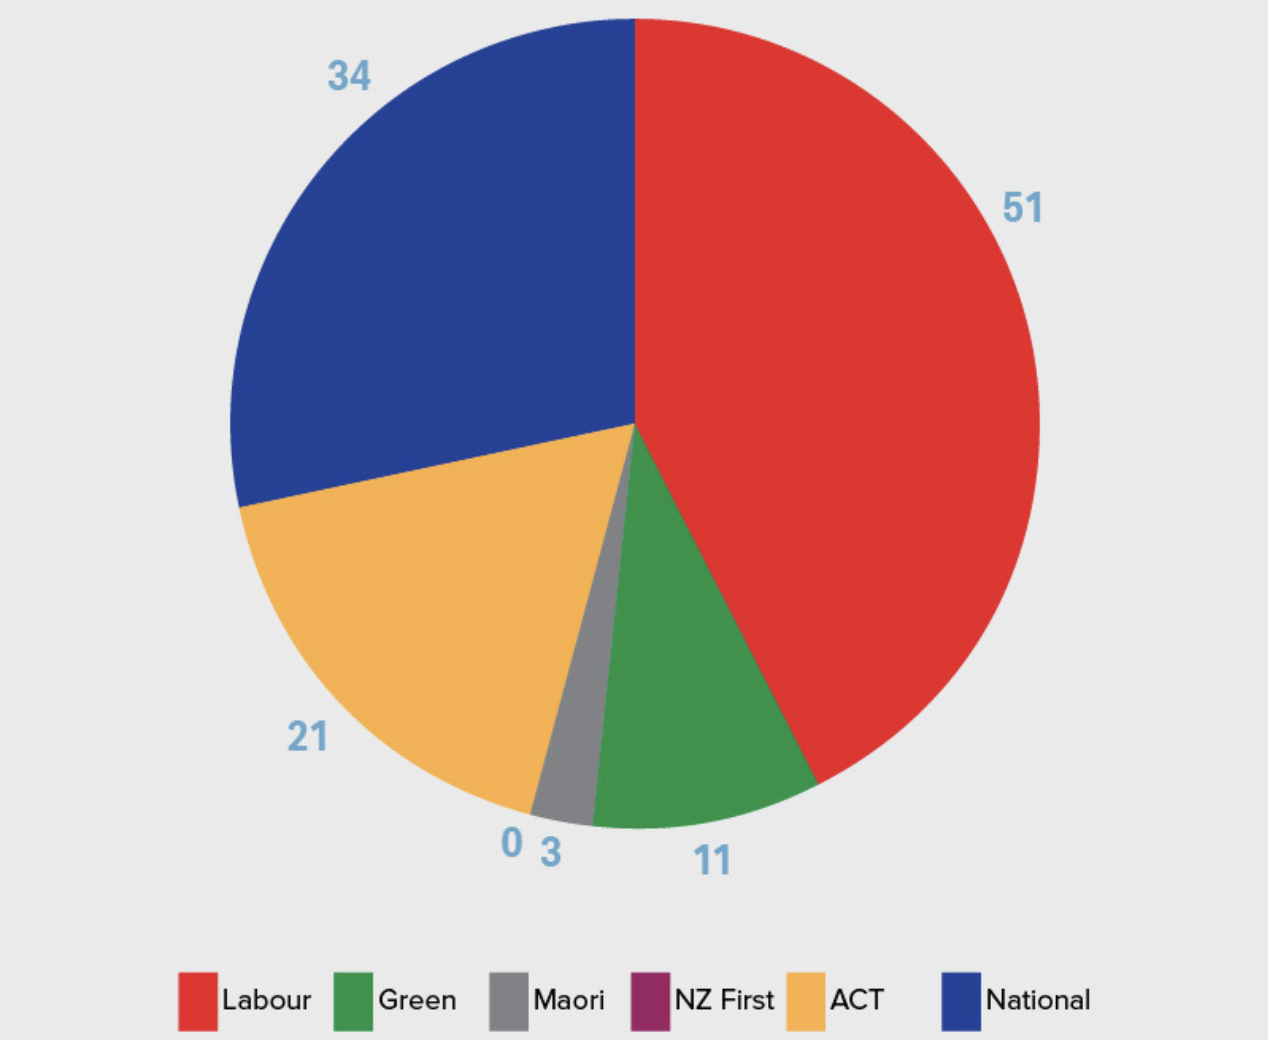
In short, the gap between the centre-left and centre-right has closed. In September the gap between National/ACT vs Labour/Green was 19.2%. Last month it was 12.1%. The gap is now 5.8%.

The hit to Labour’s support has seen a bump in support for the Greens, while a recent lift in support for NZ First is easing off.
Here is how these results would translate to seats in Parliament:

Just like the TV polls, our pollsters do not read out options to participants to choose their preferred Prime Minister – we just include those who are named as preferred by more than a few people in the random sample of one thousand voters.


Jacinda Ardern’s 13 point drop is significant, but the Prime Minister still remains well ahead of anyone else. David Seymour continues to rank second, followed by Judith Collins, Christopher Luxon, and Christopher Bishop.
Here is how the changes appear over time:

For the first time since the GFC more New Zealanders think the country is heading in the wrong direction than the right direction. This continues a trend for the year that was interrupted briefly at the onset of the Delta outbreak.

The net direction has been declining all year and dipped negative in November. The key will be. For this month 44% of respondents said New Zealand is headed in the “right direction” while 45% said “wrong direction” meaning a net -1% result.
The scientific poll was conducted by Curia Market Research and commissioned by the New Zealand Taxpayers’ Union. The full polling report is being released exclusively to members of our Taxpayer Caucus. As is well known, but for full disclosure, David Farrar is a member of the Board of the Taxpayers’ Union and also a Director of Curia Market Research Ltd.
The Taxpayers’ Union Curia Poll was conducted from Monday 1 November to Monday 8 November 2021 with the median response on Thursday 4 November 2021. The sample size was 1,000 eligible New Zealand voters who are contactable on a landline or mobile phone selected at random from 24,000 nationwide phone numbers. The results are weighted to reflect the overall voting adult population in terms of gender, age, and area. Based on this sample of 1,000 respondents, the maximum sampling error (for a result of 50%) is +/- 3.1%, at the 95% confidence level. This poll should be formally referred to as the “Taxpayers’ Union Curia Poll”.
Please share this article so that others can discover The BFD.