


John Maunder
Tauranga March Rainfalls 1898-2021
Rainfalls for the month of March have been recorded in Tauranga since 1898 – except for 1904, 1908 and 1909.
This graph below shows the range of rainfalls from a high of 504 mm in 1979, to a low of 5 mm in 1943.
The second wettest March was in 1972, when 318 mm was recorded, and two March months – 1921 and 2010 – recorded 14 mm.
The long-term average rainfall for Tauranga for March is 109 mm. The rainfall for March 2021 was 35 mm.
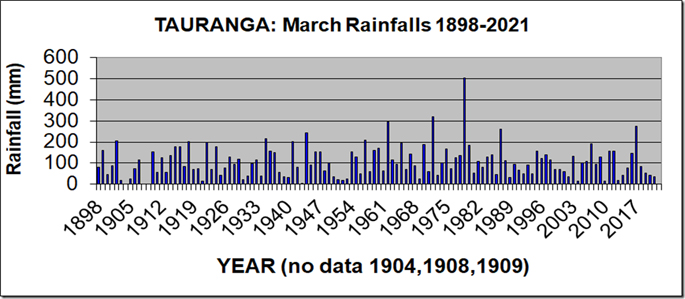
The graph shows no significant overall trend in rainfalls in March during the last 123 years, apart from a small increase in the average rainfall for the 50 years ending in 1960 of 103 mm, compared with 117 mm in the 50 years to 2010.
Since 1898, there have been eleven March months with a rainfall of 200 mm or more, and eleven March months with a rainfall of 30 mm or less.
The wettest March months in chronological order are: 1902,1918,1922,1935,1941,1944,1957,1962,1972,1979 and 1987.
The driest March months in chronological order are: 1903,1905,1921,1943,1951,1952,1953,1969, 2004, 2010 and 2013.
BUY Your Own Copy of Dr John Maunders book Fifteen Shades of Climate Today.

Please share so others can discover The BFD.