


Our favourite ‘science’ reporter is out on the bandwagon again, telling us that a climate scientist says global warming is making the rainfalls in New Zealand more intense.
Scientists have confirmed what many people in rain-soaked regions have long suspected: climate change has been driving a widespread rise in big deluges.
And they expect the patterns that have been pieced together in a just-published study to only intensify as the world warms.
Big rainfall events are one of the most damaging consequences of climate change, packing the potential to damage homes and trigger landslides and flash floods. […]
Over the past five decades, this has shown no clear evidence that intense events had changed since 1960, besides some drops and increases at certain places.
But, when looking at the picture a different way – recording all of the rain that fell across an extreme event, rather than just a day of it – the trends appeared much more dramatic.
Climate scientist Professor Jim Salinger found that, between [sic] between 1961 and 2010, annual extreme rainfall when measured by event had increased noticeably in the west and south of the South Island – and had fallen in the drier north and east of both islands.
When compared with the one-day measure, the “extreme event annual maximum” ranged from 25 per cent higher in the east, to 60 per cent higher in the west and south of the South Island.
Salinger said climate change would boost the intensity of these events even more.
With each degree of warming, he estimated the event annual maximum climbed by 5 per cent in the west of the South Island, and north-west of the North Island.
“Essentially with warming, heavy precipitation maximum annual events get wetter.” […]
A Newspaper
Yadda, yadda, yadda.
My very first thought was, “Why stop the data at 2010, why ignore the most recent data which is likely to be more accurate than measurements back in the 60s?”
So I went looking. I found the NIWA NZ Seven Station Series temperature data and graphed that. Then I found the NZ Historic Weather Events Catalog and selected ‘Heavy Rain’ from 1961 to 2018. I counted the number of events recorded per year and added that to the graph.
It then seemed to become apparent why our climate scientist stopped his data in 2010. Admittedly the climate chappie will have access to much more data than I found in an afternoon but the question remains: why cut off at 2010?
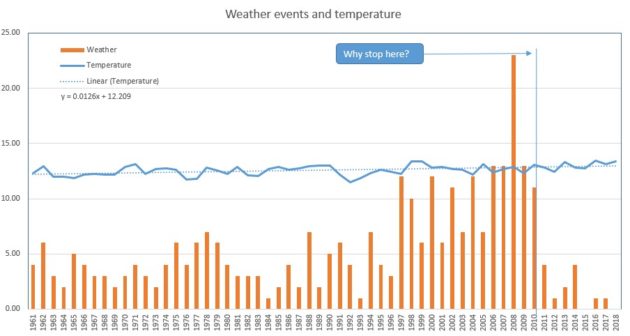
You will see a little formula in that graph, which is the trend line for temperature rise over that period: 0.13 C per decade or 1.3 C per century. And that massive rise is based on ‘adjusted’ data.
Jamie, if you are going to be a science reporter, how about asking a question or two?