Originally published at The Facts and republished with permission.
Two key Questions:
- Is the 5% party vote threshold set at the right level?
- Should we introduce STV (Single Transferable Voting) so that if your first choice doesn’t get in, your second or third choice still counts?

Explanation
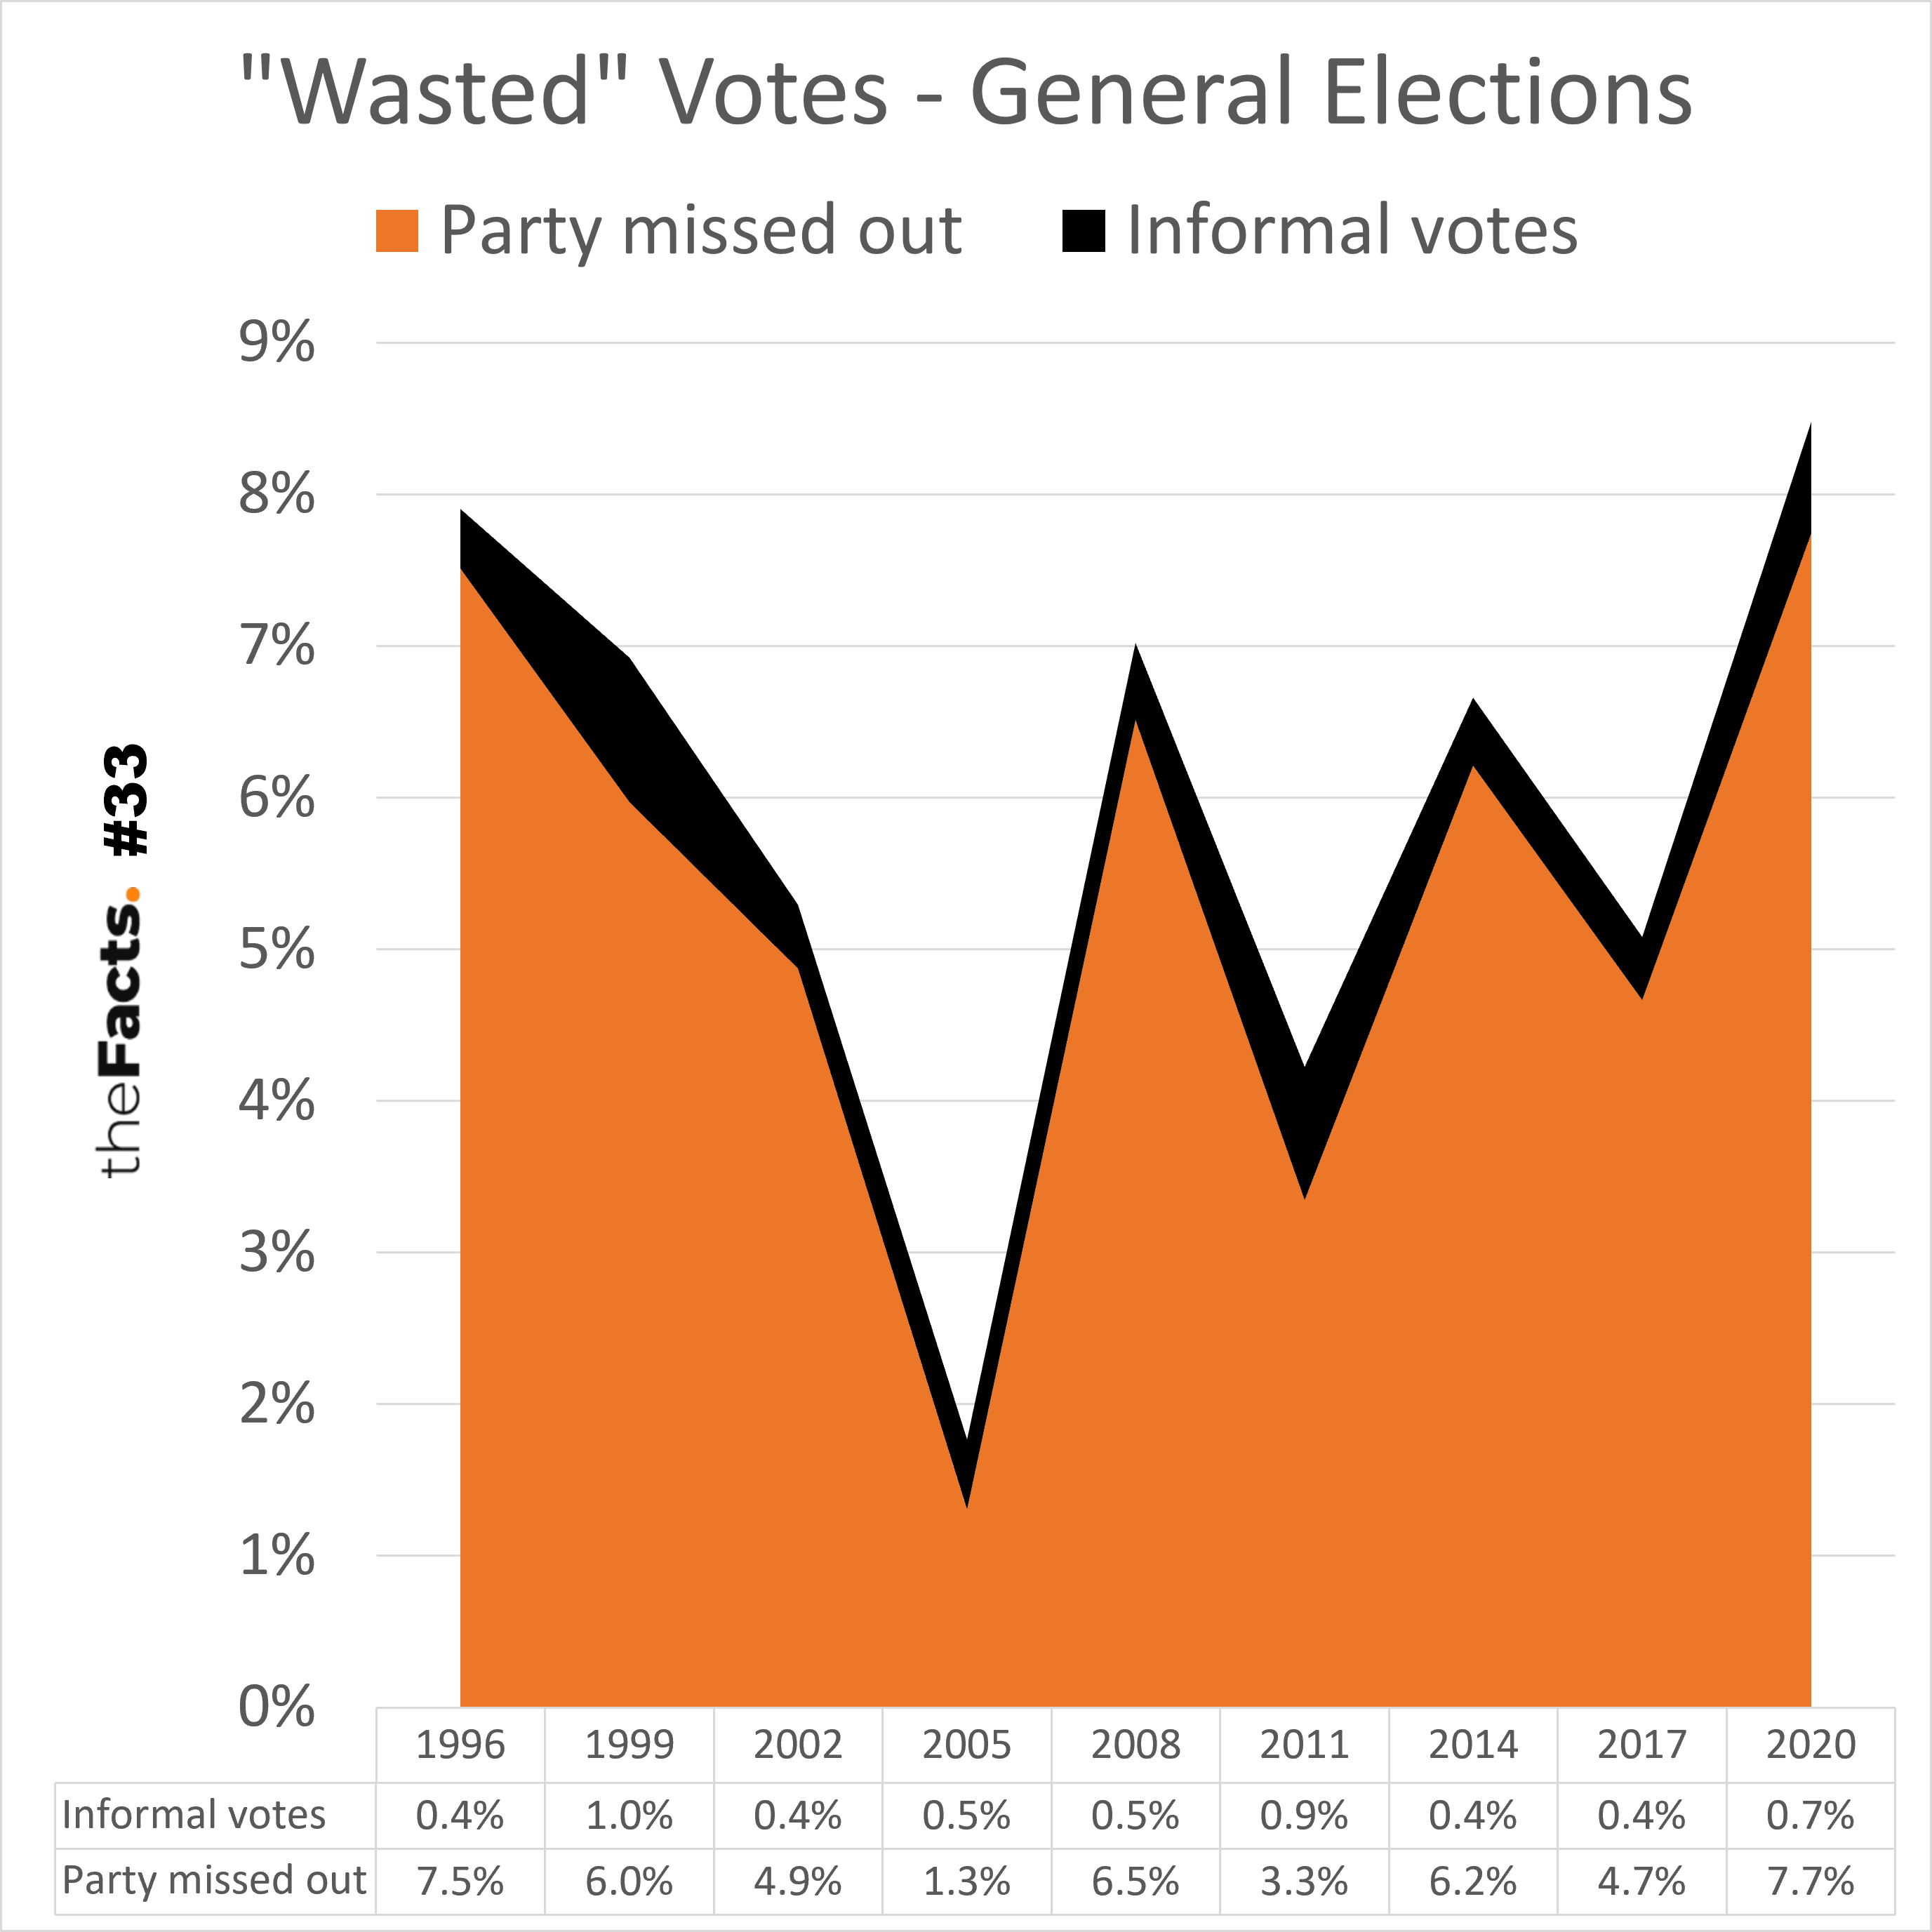
- The term “wasted vote” is commonly used to describe a party vote at a general election which is discarded because the political party did not win a seat in Parliament via either:
- Winning one of the 72 electorate seats (65 General Electorates + 7 Maori Electorates)
- Winning 5% of the overall party vote
- Some argue that it is not a wasted vote, as it still shows support for that party, or a protest vote against other parties
- We couldn’t find a good definition/explanation of an “informal vote” in the data, on NZ Government Department websites, or in The Electoral Act 1993, but have asked for this. Here is Australia’s:“When a ballot paper has not been fully completed, is completed incorrectly or you can identify the person who voted, it is known as an ‘informal vote’, and will not be counted toward the election result.”
- The average of “wasted votes” (party didn’t get in + informal votes) across the nine elections from 1996 to 2020 is 5.9%
Other notes:
- New Zealand’s electoral system changed from FPP (First Past the Post) in 1993 to MMP (Mixed Member Proportional) in 1996. Under FPP, voters only got one vote for a candidate in their local electorate, so the definition of “wasted votes” is very different, e.g. you might have voted for a party candidate who didn’t win their electorate seat, but their party formed the Government. Or, someone might have won their electorate seat with, say, 40% of the vote so, arguably, 60% of votes were “wasted”. This is why we have focused on MMP election data only where voters can vote for political parties as well.
- In the Electoral Commission’s Report that was released in October 2012, they recommended several changes, including lowering the party vote threshold from 5% to 4%.
- All numbers are provisional and subject to revision.
Thank you to the Factors who helped pull this together.
SOURCES:
2020 – https://archive.electionresults.govt.nz/electionresults_2020/statistics/overall-results-summary.html
2017 – https://archive.electionresults.govt.nz/electionresults_2017/statistics/overall-results-summary.html
2014 – https://archive.electionresults.govt.nz/electionresults_2014/e9/html/e9_part1.html
2011 – https://archive.electionresults.govt.nz/electionresults_2011/e9/html/e9_part1.html
2008 – https://archive.electionresults.govt.nz/electionresults_2008/e9/html/e9_part1.html
2005 – https://archive.electionresults.govt.nz/electionresults_2005/e9/html/e9_part1.html
2002 – https://archive.electionresults.govt.nz/electionresults_2002/e9/html/e9_part1.html
1999 – https://archive.electionresults.govt.nz/electionresults_1999/e9/html/e9_partI.html
1996 – https://archive.electionresults.govt.nz/electionresults_1996/pdf/1.1%20Summary%20of%20overall%20results.pdf
Data published by The Electoral Commission
(c) Crown Copyright
Licensed for use under the creative commons attribution licence (BY) 4.0
Please share this article so others can discover The BFD.
