


Alwyn Poole
The Ministry of Education in NZ have as their motto that:
“We shape an education system that delivers equitable and excellent outcomes.”
The data tells a very different story. Our system is stratified in terms of socio-economics (decile), ethnicity, gender, schools types (faith-based vs value-free).
Even these comments on the most recent PISA results say we differ from the equity in other nations.
“The average difference between advantaged and disadvantaged students in reading is 96 points, compared to an average of 89 in OECD countries.”
“The score difference in science between the 10% of students with the highest scores and the 10% of students with the lowest scores is one of the largest among PISA-participating countries and economies.”
“In New Zealand, 15-year-old students have a strong fear of failure.”
“Unfortunately, the PISA study highlights a persistent challenge for New Zealand, which is our high rates of bullying. Fifteen percent of 15-year-olds report being frequently bullied – double the OECD average.”
I have been working through a major data project on the state of education in New Zealand and a lot of information is emerging.
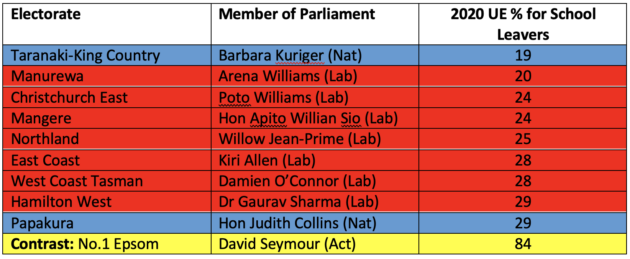
As a point of political interest; here is the political oversight of the electorates sorted for ambition, based on the University Entrance achievements.
The data set is in spreadsheet form and includes sheets on
- high-school size – largest to smallest
- number of 2020 leavers – largest to smallest.
- Level 3 NCEA and above percentage for school leavers for each school 2018-20 (ranked highest to lowest for 2020).
- UE percentage for school leavers for each school 2018-20 (ranked highest to lowest for 2020).
- Each school’s UE percentage for leavers for 2020 compared to decile mean and ranked highest to lowest across all schools.
- Level 3 NCEA and above gap to UE for leavers 2018-20 and ranked smallest to largest for 2020.
- Retention percentage until 17 years of age for each school and ranked highest to lowest.
- Percentage for each school of their leavers going onto L7+ Degree study – ranked highest to lowest.
- The anonymised data mean for full attendance across deciles 2018-20.
- UE percentage by school governance and school type.
It should be of interest to every school, politician, parent and anyone interested in improving NZ’s education system and future society.
Enquiries for the data set to: [email protected]