


Lindsay Mitchell
lindsaymitchell.blogspot.com
Lindsay Mitchell has been researching and commenting on welfare since 2001. Many of her articles have been published in mainstream media and she has appeared on radio, tv and before select committees discussing issues relating to welfare. Lindsay is also an artist who works under commission and exhibits at Wellington, New Zealand, galleries.
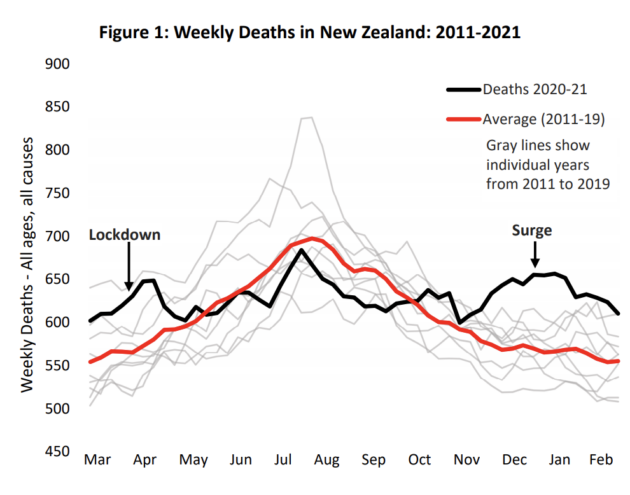
From the University of Waikato, this is a multi-layered chart.
The black line depicts deaths during the year from just before the first lockdown to the end of Feb 2021.
The gray lines depict deaths in the same period for each of the prior 9 years.
The red line depicts nine-year average deaths in the same months.
The black line veers strongly away from the norm after October/November 2020.
Officially:
“The fall in all – causes mortality after lockdowns in 2020 is only a short-term effect. A winter of no excess mortality was followed by four months of excess mortality totaling about 1200 deaths (ca. four percent of annual deaths). The surge in deaths was concentrated on the elderly so public health interventions only slightly postponed death. Repeating Covid control measures in future to deal with seasonal influenza may provide just short – term benefits.”
But there was also a small “surge” in deaths in 0-64 year-olds around Dec/Nov:

I can only speculate.
But Covid definitely affected death rates – just not in the way anticipated.
Please share this article so that others can discover The BFD.