
John Maunder
Monthly rainfalls for Tauranga have been recorded at several recording sites during the last 122 years.
The rainfall for Tauranga for 2021 was 959 mm.
From January 1898 to December 1904, the observation site was described as the Tauranga Harbour, from November 1904 to April 1907 the site was described as simply ‘Tauranga’. From January 1910 to December 1923 the site was Waikareao, in Otumoetai; from January 1924 to September 1940 the site was at 148 Waihi Rd, in Judea; from October 1940 to January 1941 the site was at Te Puna; and from February 1941 to now, the site is Tauranga Airport.
The methodology used in adjusting the older sites to the current observing site was published in the NZ Meteorological Service Miscellaneous Publication No 180 in 1984. It is considered that the homogeneous rainfall series described here is a fair and true record of what the rainfall would have been if the current observation site (Tauranga Airport) had been used since 1898.
This should be coupled with the understanding that although standard accepted methodologies have been used, any adjustments are only estimates of what would have occurred if the location of the rainfall records had always been in the same place with the same surroundings and the same or similar recording gauge.
In terms of climate change (such as is it getting wetter or drier, or warmer or colder), the methodology used in computing an ‘official’ set of climate observations is very important, as otherwise erroneous conclusions may be drawn.
The long-term average rainfall for Tauranga for the calendar year is 1300 mm, ranging from a low of 747 mm in 2002, to a high of 2049 mm in 1962. For comparison, the rainfall for the year 2020 was 774 mm which was the third driest year on record, and for 2021 it was 959 mm.
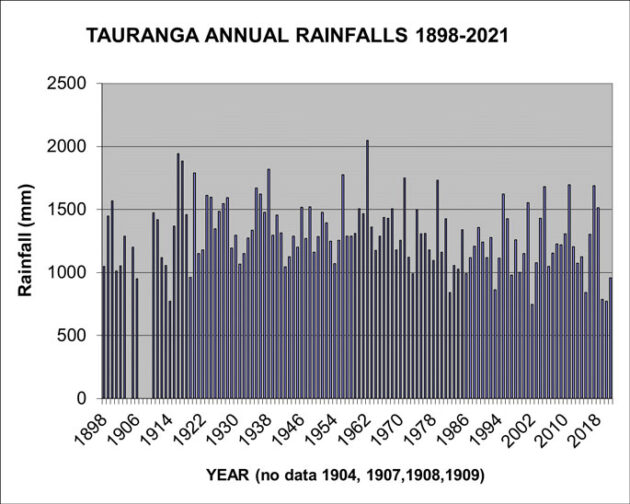
Since 1898, there have been only six years with a rainfall of less than 900 mm, they are 1914, 1982, 1993, 2002, 2019, and 2020, and there has only been four years with a rainfall of more than 1800 mm; they are the two consecutive years of 1916 and 1917, plus 1938 and 1962.
In chronological order, the wettest years occurred in 1916, 1917, 1920, 1935, 1938, 1956, 1962, 1979, 2005 and 2011; and the driest years occurred in 1906, 1914, 1919, 1973, 1982, 1986, 1993, 1997, 1999, and 2002.
The average rainfall in Tauranga for the 50 years 1911-60 was 1365 mm, compared with the average rainfall for the 50 years 1961-2010 of 1263 mm.
For further information on a range of weather and climate matters read my recently published book “ Fifteen shades of climate”
BUY Your Own Copy of Dr John Maunders book Fifteen Shades of Climate Today.