

John Maunder
The average afternoon temperature in 2021 was 20.2 degrees Celsius, which made 2021 the fourth warmest year on record.
Temperatures have been recorded in the Tauranga area at several sites in the last 108 years, including the current Tauranga Airport site from June 1990.
It’s very common for areas such as Tauranga to have had different observation sites during the years, and readings from the earlier sites have been adjusted to the present site using standard climatological procedures. The temperature series described here is a record of what the temperature would have been if the current observation site, Tauranga Airport, had been used throughout the period. It’s important to note, in considering climate change, the methodology used in computing an official set of climate observations is very important as otherwise erroneous conclusions may be drawn. Traditionally, temperature observations have been recorded with a set of maximum and minimum temperature thermometers. These record the daily maximum temperature, usually recorded in mid-afternoon, and daily minimum temperature, usually recorded just before dawn.
This analysis of temperatures for Tauranga is for the average daily maximum temperatures.
The graph below shows details of the average annual daily maximum temperatures (called simply ‘afternoon’), for Tauranga for the years 1914-2021.
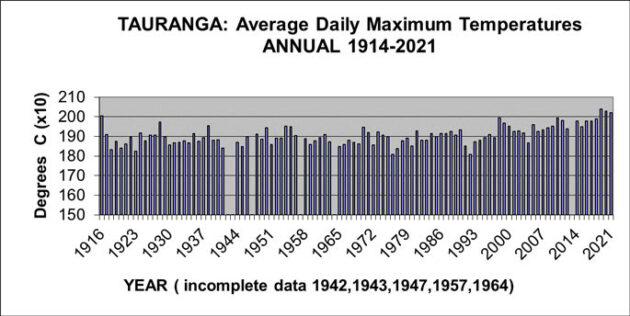
The long-term average afternoon temperatures for Tauranga for a calendar year is 18.6 degrees Celsius, including the cool years of 18.1 degrees Celsius in 1976, 18.1 degrees Celsius in 1992, 18.2 degrees Celsius in 1923, and 18.3 degrees Celsius in 1918.
In contrast, Tauranga’s warmest years (in terms of the average afternoon temperature) are: 20.4 degrees in 2019, 20.3 degrees in 2020, 20.2 degrees Celsius in 2013 and 2021, 20.1 degrees Celsius in 1916, 20.0 degrees Celsius in 1998, 19.9 degrees Celsius in 2010, 2016 and 2018, and 19.8 degrees Celsius in 1915, 2011, 2014, and 2017.
Since 1914, there have been seventeen calendar years with an average afternoon temperature of 19.6 degrees Celsius or more. In chronological order these years are: 1914, 1915, 1916, 1928, 1998, 1999, 2005, 2010, 2011, 2013, 2014, 2016, 2017, 2018, 2019, 2020 and 2021.
In contrast, there have been 11 calendar years with an average afternoon temperature of 18.5 degrees Celsius or less. In chronological order these years are: 1918, 1920, 1923, 1941, 1945, 1965, 1976, 1977, 1980, 1991, and 1992.
The graph of the average afternoon temperatures for the years 1914-2021 shows generally normal variations from year to year from 1915 to the mid-1990’s, followed by several years of above-average temperatures, including the eight of the last nine years.
The annual average afternoon temperature shows a warming of about 0.8 degrees Celsius during the 51 years from 1963-2013 from 19.0 degrees Celsius, compared with 18.2 degrees Celsius during the 49 years from 1914-1962.
For further Infomation about a wide range of weather/climate matters see my new book Fifteen shades of climate… the fall of the weather dice and the butterfly effect.
The idea for the book came about when I was visiting my family in Adelaide in January 2020 during a heatwave. One day when the forecast was for 45°C my daughter Denise suggested I should stay inside, shelter from the heat and write another book. I asked what did she have in mind and she simply said Climate the Truth. My son Philip who has lived in Adelaide for about 30 years thought it was a good idea but after a few days thought I settled on Fifteen Shades of Climate.
BUY Your Own Copy of Dr John Maunders book Fifteen Shades of Climate Today.
Please share so others can discover The BFD.