


John Maunder
Rainfalls for the month of September have been recorded in Tauranga since 1898, except for 1904, 1907, 1908, and 1909.
The graph below shows the range of rainfalls from an extreme high of 274 mm in 1973 to a low of only 16 mm in 1965.
The second wettest September was in 1900 when 256 mm was recorded, and the second driest September was in 1944 when only 27 mm fell. The long-term average rainfall for Tauranga for September is 105 mm.
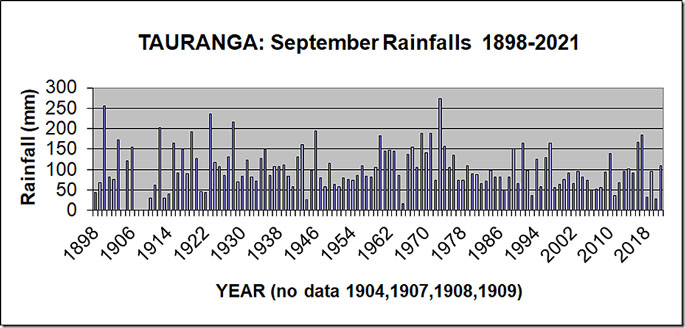
The graph of the September rainfall shows normal variations from year to year. Since 1898, there have been five Septembers with a rainfall of 200 mm or more (four of which occurred during the period 1900 to 1928, but there’s only been one since then), compared with seven September months with a rainfalls of 40 mm or less.
The rainfall for September 2021 was 110 mm.
In chronological order, the ten wettest September months (rainfalls over 180 mm) are 1900,1912,1919,1923,1928,1946,1960,1969,1971,1973, and 2017.
In contrast the thirteenth driest September months (rainfalls of 50 mm or less) are 1910, 1913, 1914, 1921, 1922, 1944, 1965, 1993, 1987, 2006, 2011, 2018 and 2020.
The average rainfall for Tauranga for September for the 50 years 1961-2010 of 103 mm is similar to the rainfall for the previous 50 years (1910-1960).
Tauranga September Average Afternoon Temperatures 1913-2021
Temperatures have been recorded in the Tauranga area at several sites in the last 109 years, including the current Tauranga Airport site from June 1990.
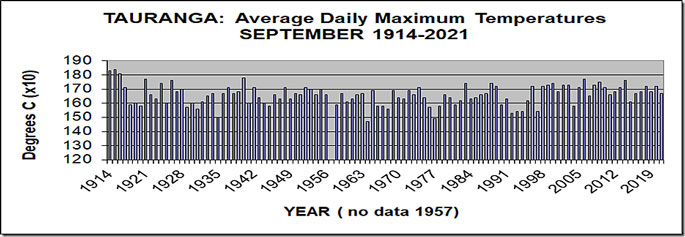
The graph shows details of the average daily maximum temperatures (simply called “afternoon”) for Tauranga for September from 1913-2021.
The long-term average afternoon temperature in September for Tauranga is 16.6 degrees C, ranging from the “cool” September months of 1964 (14.8 degrees C), and 1977 (14.9 degrees C), to the “warm” September months of 1915 (18.4 degrees C), and 18.3 degrees in 1914.
The afternoon temperature for 2021 was 16.7 degrees C.
The graph of the average afternoon temperatures for September shows generally “normal” variations from September to September during the last 100 years.
From 1913 to 2011, there have been ten September months with an average afternoon temperature of 17.5 degrees C or more, and eight September months with an average afternoon temperature of less than 15.4 degrees C.
The tenth “warmest” September months (in terms of afternoon temperatures) on record, in chronological order, are 1913, 1914, 1915, 1916, 1921, 1926, 1940, 2006, 2009 and 2014.
By contrast, the eighth “coolest” September months (in terms of afternoon temperatures) on record, in chronological order, are 1935, 1964, 1967, 1977, 1992, 1993, 1994 and 1997.
The average afternoon temperature during September for the period 1914-62 was 16.6 degrees, compared with 16.5 degrees from 1963-2011.
For further Infomation about a wide range of weather/climate matters see my new book Fifteen shades of climate… the fall of the weather dice and the butterfly effect.
BUY Your Own Copy of Dr John Maunders book Fifteen Shades of Climate Today.

Please share so others can discover The BFD.