


John Maunder
sunlive.co.nz
Rainfalls for the month of May have been recorded in Tauranga since 1898 – except for 1904, 1907, 1908, and 1909.
The graph shows the range of rainfalls from an extreme high of 634 mm in 2005 to a low of 13 mm in 2001. The rainfall for May 2021 was 113 mm.
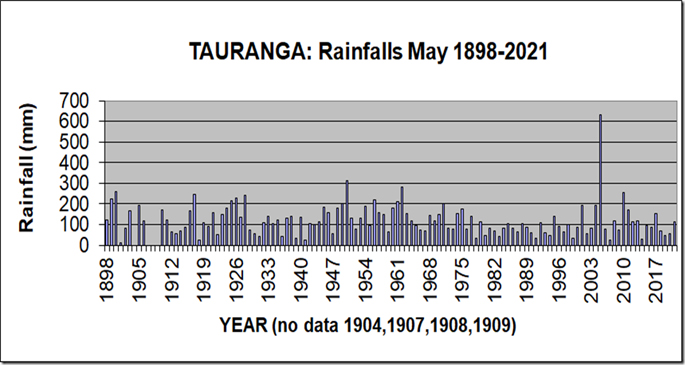
The second wettest May was 1950, when 311 mm was recorded, and the second driest May was in 1918, when only 24 mm fell. The long-term average rainfall for Tauranga for May is 124 mm.
Apart from the exceptional rainfall of 634 mm in May 2005, the graph shows a small decrease in overall May rainfalls over the last 123 months.
Since 1898, there have been 14 May months with a rainfall of 200 mm or more. In chronological order, the wettest May months are: 1899, 1900, 1917, 1925, 1926, 1928, 1949, 1950, 1956, 1961, 1962, 1971, 2005, and 2010.
In terms of dry May months, there have been only nine May months with rainfall of less than 40 mm. In chronological order, the driest May months are: 1901, 1918, 1939, 1941, 1978, 1991, 1999, 2007, and 2014.
Of particular significance is the exceptional rainfall in May 2005. I estimated that such a rainfall is likely to occur in Tauranga only about twice in every 1000 years. This suggests central government could have had a much more important role in financial implications of the floods, which affected many areas of Tauranga in May 2005.
For further information on a variety of weather and climate matters read my new book “Fifteen Shades of Climate”.
BUY Your Own Copy of Dr John Maunders book Fifteen Shades of Climate Today.

Please share so others can discover The BFD.