


Dr John Maunder
sunlive.co.nz
The chart below shows that since 1979, when reliable satellite observations became available, there has been little overall trend in the average tropospheric temperatures, apart from milder/warmer temperatures since about 1997, and two significant warm periods associated with the El Nino events in 1998 and 2015-16.
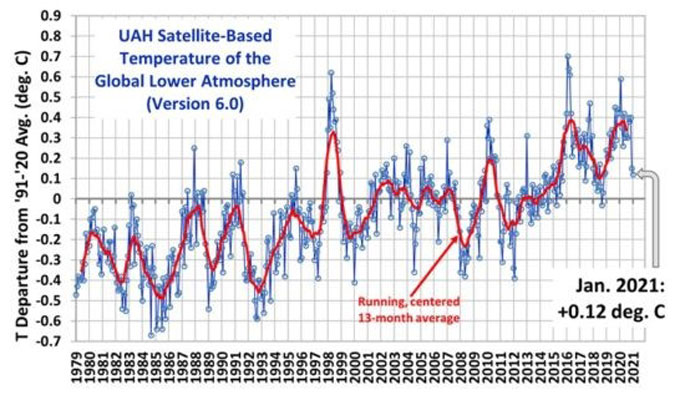
The latest global average temperatures of the troposphere updated to January 2021 – observed from US National Oceanic and Atmospheric Administration satellites – are computed by the University of Alabama at Huntsville in the United States. The data shows variations from the 30 year period 1981-2010.
Since 1979, NOAA satellites have been carrying instruments which measure the natural microwave thermal emissions from oxygen in the atmosphere. The intensity of the signals these microwave radiometers measure at different microwave frequencies is directly proportional to the temperature of different, deep layers of the atmosphere. Every month, researchers at the University of Alabama (Dr John Christy and Dr Roy Spencer) update global temperature datasets that represent the piecing together of the temperature data from a total of fourteen instruments flying on different satellites over the years.
The graph above represents the latest update; updates are usually made within the first week of every month. Contrary to some reports, the satellite measurements are not calibrated in any way with the global surface-based thermometer records of temperature. They instead use their own on-board precision redundant platinum resistance thermometers calibrated to a laboratory reference standard before launch.
The troposphere is the lowest layer of Earth’s atmosphere.
It contains approximately 75 per cent of the atmosphere’s mass and 99 per cent of its water vapour and aerosols.
The average depth of the troposphere is approximately 17 km in the middle latitudes.
The latest data for December 2020 is +0.27 degrees C and for January 2012 +0.12 degrees C.
The coolest months since 1979 were September 1984, with minus 0.49 degrees Celsius, and November 1984, with minus 0.42 degrees Celsius.
The warmest months were February 2016 with plus 0.83 degrees C, February and April 1998, and February 2020, all plus 0.76 degrees Celsius, and March 2016 plus 0.73 degrees, and April 2016 plus 0.73 degrees Celsius.
The chart shows the El Nino warming in the 1998 period, and 2015-16, and the Mount Pinatubo, volcanic cooling during 1992-1993.
For further information on a range of weather and climate matters read my just-published book “ Fifteen shades of climate”
BUY Your Own Copy of Dr John Maunders book Fifteen Shades of Climate Today.

Please share so others can discover The BFD.