

How many times has this phrase been rolled out in the Global Warming disaster era? Whether it is temperature or CO2 levels or sea levels or whatever, there is nothing like a ‘highest ever’ headline to grab a bit of clickbait.

NOAA boldly states:
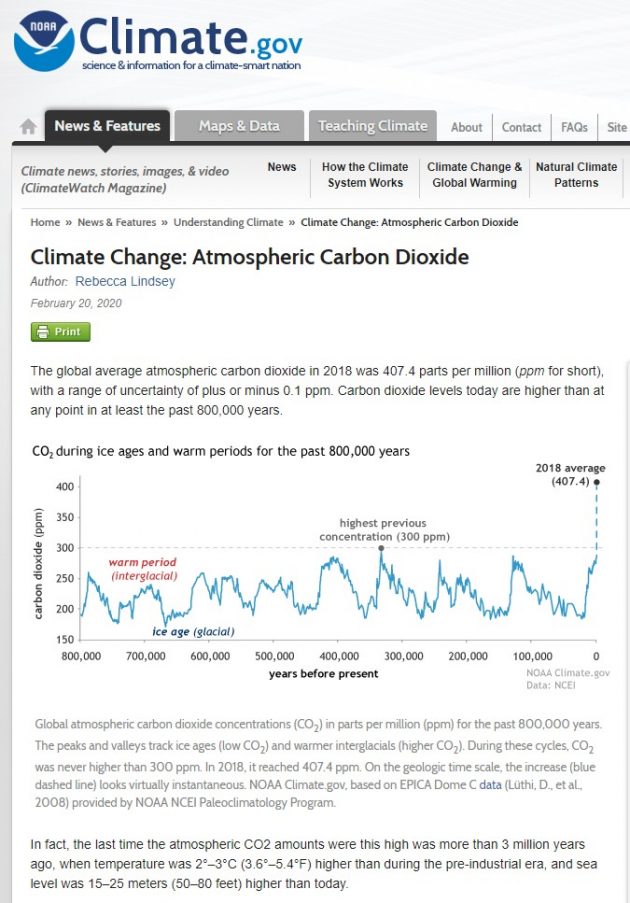
Carbon dioxide levels today are higher than at any point in at least the past 800,000 years.[…]
In fact, the last time the atmospheric CO2 amounts were this high was more than 3 million years ago, when temperature was 2°–3°C (3.6°–5.4°F) higher than during the pre-industrial era, and sea level was 15–25 meters (50–80 feet) higher than today.
NOAA says that the highest previous concentration was 300ppm some 300,000 years ago. I wasn’t around then so cannot possibly comment.
But, what if it wasn’t actually true?
If I can be so bold, I refer the reader to a paper from 2007 where a diligent researcher looked back through the published papers from the 19th century when scientific advancements allowed such things as the CO2 concentration in the atmosphere to be reliably and repeatably measured.
A re-evaluation has been undertaken of the historical literature on atmospheric CO2 levels since the introduction of reliable chemical measuring techniques in the early to middle 19th century. More than 90,000 individual determinations of CO2 levels are reported between 1812 and 1961. The great majority of these determinations were made by skilled investigators using well established laboratory analytical techniques. Data from 138 sources and locations have been combined to produce a yearly average atmospheric CO2 curve for the northern hemisphere.
So what did Beck find when he researched, accumulated and averaged all the available data?

My parents lived through the peak CO2 measured from 1930 to 1950 (“the last time atmospheric CO2 levels were this high”) and I am struggling to recall their stories of the seas being 15 -25 m higher than today. Perhaps I am unconsciously blocking these memories?
Let’s have a closer look at the 1939-1940 peak.
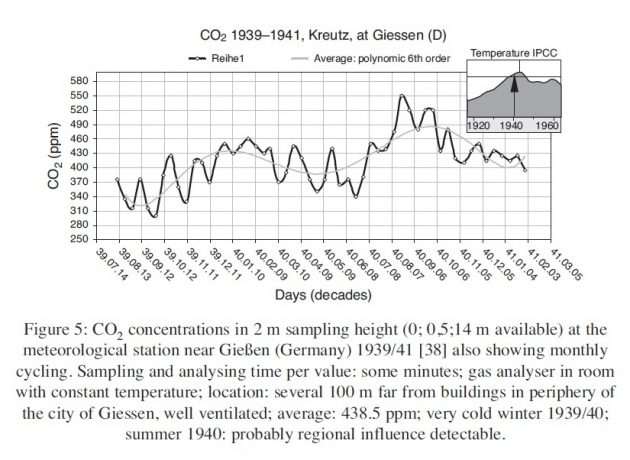
Equipped with the best available hardware at that time Kreutz installed 4 places for parallel data acquisition for the measurement series beween 1939 to 1941, measuring all weather parameters including radiation, temperature, pressure, humidity, wind etc. Over an 18 month period he analysed more than 64,000 single CO2 values at a rate of 120 samples per day, using a gas analyser designed by Riedel & Co. in Essen, Germany and the famous expert in gas analysis, Paul Schuftan (Linde & Co (D), later BOC UK). In his paper Kreutz’s results delineate well both the seasonal cycle and weather events around the city of Giessen, and confirm strikingly the persistence of CO2 levels above 400 ppm over most of a period of 2 years.
Sounds like a fairly thorough and robust data set to me.
The overall average CO2 level for the 25,000 values plotted from Giessen is 438.5 ppm. This figure needs to be adjusted downwards to take account of anthropogenic sources of CO2 from nearby city, an influence that has been estimated as lying between 10 and 70 ppm (average 30 ppm) by different authors. Even after making this adjustment, the Giessen results strongly contradict modern (IPCC) estimates of carbon dioxide levels during the 1940s.
Is the world teetering on the edge of a CO2 precipice unknown in recorded history or is the slowly rising concentration of plant food in the form of a harmless trace gas nothing to get excited about? I guess the answer depends on who you ask.
If you enjoyed this BFD article please consider sharing it with your friends.