


Simon Thornley
covidplanb.co.nz
Most New Zealanders believe now that we are in an exalted position on the COVID road. We are world leaders who have beaten a deadly virus thanks to a tough lockdown. Our only threat now remains from overseas travellers who are quarantined at the border. We are now a COVID-19 free paradise. We can stay this way until a promising vaccine from Oxford comes our way. Surely, this is a matter of holding on for a few more months, and then we can put this whole episode behind us and get on with life?
I would like to believe this story, since my life would be much simpler if I followed the official line. But as an epidemiologist, I’m taught to question and to examine the evidence independently. There are a number of assumptions in this story we have been told. Let’s examine them one by one.
The first is that we are dealing with a deadly virus. Early on in the pandemic, it was possible to believe this, as we had only genetic tests of the virus available. The ratio of people who had died with COVID-19 divided by people who tested positive was 3.4%. This is about seven times the usual estimates of fatality from seasonal influenza (<0.5%).
High fatality rates were projected on a grand scale by modellers. These high rates lead to astronomical predictions of death and destruction which justified severe lockdowns.
Throwing the kitchen sink at such a deadly threat made sense. Just as with swine flu in 2009, however, it was soon found that other evidence, such as antibodies detected in blood, showed a totally different pattern. This occurred in 2009 when antibodies were discovered in about one in four of the New Zealand population. The clamour to eliminate the virus lost its legs.
Early in the epidemic, other researchers overseas were pointing to similar evidence. Professor Mikko Paunio, for example, an epidemiologist from Finland, early in the epidemic showed that 27/1000 blood donors had antibodies to the virus in Copenhagen, Denmark. This proportion extrapolated to over a million Danes having seen and recovered from the virus, compared to many fewer ‘official’ cases. The revised fatality rate was 0.13% – nothing to get excited over.
Now, we even have the Center of Disease Control in the US using 0.65% as a working estimate. This is derived from a summary paper which averaged the results of 26 individual studies. This revised figure is in the scale of severe influenza and scales down the threat of the virus to just above that of seasonal influenza. These estimates don’t take into account more information about T-cells which now show an even wider exposure to the virus than from antibodies alone. This means that even these revised estimates are very conservative and should be lower still.
In New Zealand, it is clear from looking only at cases, that risk of fatality is higher for older people (Table). People aged over 90 years have not fared well after infection, but conversely, we have now had no deaths from the virus in people aged under 59 years.
Table. COVID-19 cases in New Zealand, by clinical status and age group (at 20 July 2020).
| Age Group (years) | Active | Recovered | Deceased | Case fatality ratio* (%) | Total |
| 0 to 9 | 1 | 37 | 0 | 0 | 38 |
| 10 to 19 | 0 | 122 | 0 | 0 | 122 |
| 20 to 29 | 8 | 365 | 0 | 0 | 373 |
| 30 to 39 | 9 | 239 | 0 | 0 | 248 |
| 40 to 49 | 1 | 221 | 0 | 0 | 222 |
| 50 to 59 | 3 | 247 | 0 | 0 | 250 |
| 60 to 69 | 2 | 177 | 3 | 1.67 | 182 |
| 70 to 79 | 2 | 71 | 7 | 8.97 | 80 |
| 80 to 89 | 0 | 23 | 7 | 23.3 | 30 |
| 90 or more | 0 | 4 | 5 | 55.6 | 9 |
| Total | 26 | 1506 | 22 | 1.44 | 1554 |
*The ratio of deceased PCR test-positive cases divided by the sum of both deceased and recovered. The infection fatality ratio is likely to be much lower owing to serology and T-cells pointing to more widespread infection compared to PCR test-positive cases only. 95% confidence intervals calculated by exact binomial method. CI: confidence interval.
Source: https://www.health.govt.nz/our-work/diseases-and-conditions/covid-19-novel-coronavirus/covid-19-current-situation/covid-19-current-cases Accessed 20 July 2020.
It is also clear that around the world the average age of death of COVID-19 patients is near that of the average life expectancy of that country. This is also clear for New Zealand (figure 1), where the shape of the age distribution of Covid-19 deaths closely approximates the spread of deaths over the same period the year before. A formal test for differences in counts between these data sources shows no evidence of difference. It is very difficult to argue from this plot, that COVID-19 is shortening life spans.
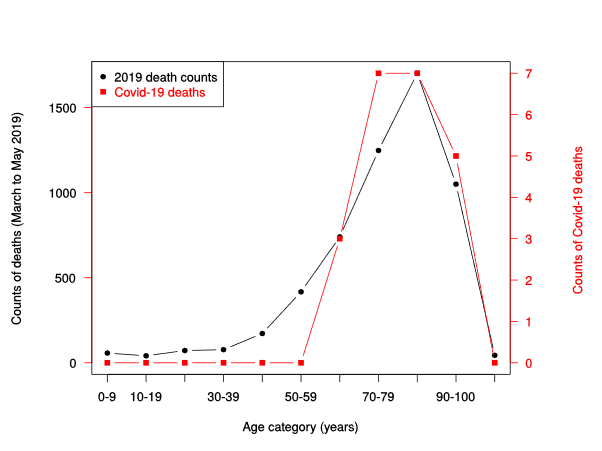
Figure 1. Counts of NZ deaths March to May 2019 (black line), compared to counts of deaths from COVID-19 (red line, right vertical axis), by age category.
Sources: https://fyi.org.nz/request/12583-number-of-deaths-by-age-group-and-week-for-the-last-5-years-dia
https://www.health.govt.nz/our-work/diseases-and-conditions/covid-19-novel-coronavirus/covid-19-current-situation/covid-19-current-cases Accessed 20 July 2020.
Although commentators are lampooning Sweden and their COVID-19 death rates, it is clear that countries with harsh lockdowns, such as Peru have higher rates of COVID-19 deaths than Sweden. Belgium, UK and Spain, all locked down but suffered higher rates of COVID-19 deaths than the comparatively liberal Swedes. Just what explains the difference between these country’s rates of COVID deaths is still unclear, but much is likely to be explained by differences in recording of deaths, demographic differences and population density. We now know that national lockdowns during the epidemic are not associated with an expected reduction in COVID-19 deaths.
Despite the avalanche of evidence coming from overseas, the New Zealand Ministry of Health has clearly stated that it has little interest in serology and is not planning a serosurvey. This strongly indicates that an updating of the fatality of the virus is unlikely in New Zealand, at least in official circles.
Where does this leave New Zealand? Our borders remain closed and both political parties are doubling down on this action. In contrast, other countries including the vast majority of Europe, Iceland, China, and the UK are opening up their borders. Iceland has had its borders largely opened, albeit with virus screening, since June 15 with no evidence of a further outbreak (figure 2). It is clear that these governments have learned from new information, reassessed the risk posed by the virus to their populations, including their immune status.
Evidence of widespread immunity, both in the form of antibodies and T cells is growing. In New Zealand, our politicians and health leaders have little interest in investigating this important issue. A vaccine is simply not a realistic proposition for at least another four years, if not ten. Our tourist economy and borders simply cannot wait this long. We will be held hostage to a story associated with the virus that is well past its “used by” date.
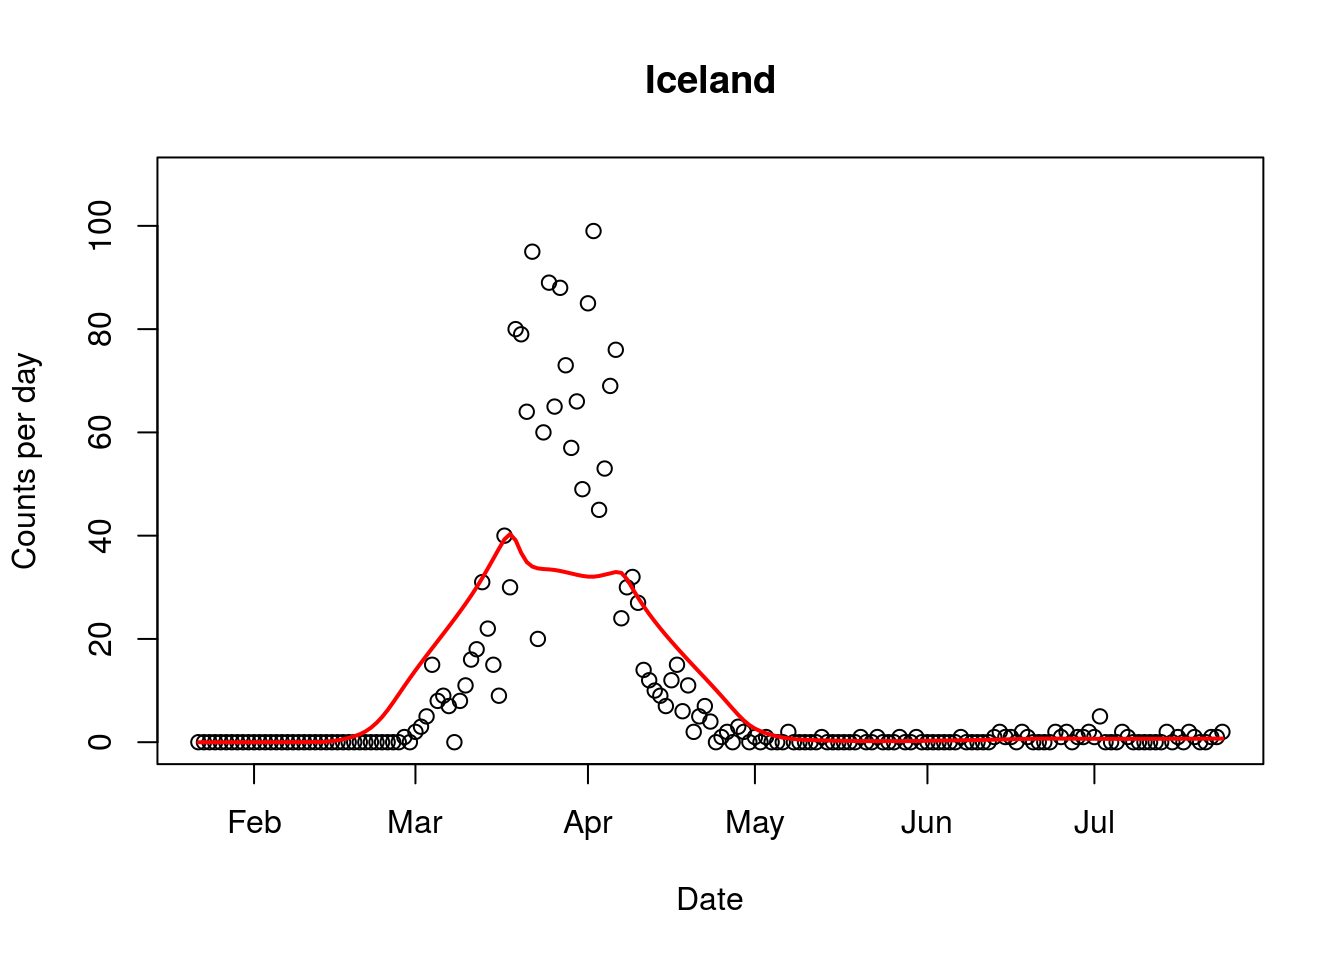
Figure 2. Covid-19 epidemic curve from Iceland, with border opening occurring in mid June. Red line indicates average trend.
If you found this BFD article interesting please share it with others.